The Ruby Craftsman

Visualize Ruby Execution

In my last post, I showed how Ruby code could be transformed into a flowchart using static analysis, which is done with the gem VisualizeRuby. Building upon that I’ve added the ability to show the execution path on the flowchart. It highlights each corresponding node for each line of code executed. For building flowcharts with Ruby code I’ve got a neat demo page, but to add the execution path to this demo would be a security issue, see remote code execution vulnerability. Since there is not an easy way to make that happen safely, you’ll have to follow along at home on your own computer’s.
Follow the installation instructions on github
Let’s talk about a use case for this. I used to work for a lending company and wrote their decision logic. The business was always asking for high grain details of how a decision was made. Even though there were individual rules that gave their owns results, there were often intermediate values or decisions that were not exposed. For example, there was a bankruptcy rule that could decline for 3 different reasons and each of those having their own conditions and in-memory computed values. Being able to present this on a flowchart would have clearly shown why a particular decision was made. This view into the logic would give non-technical persons access to understand better and verify it’s correctness. It also gives the ability to audit individual applications that need further investigation.
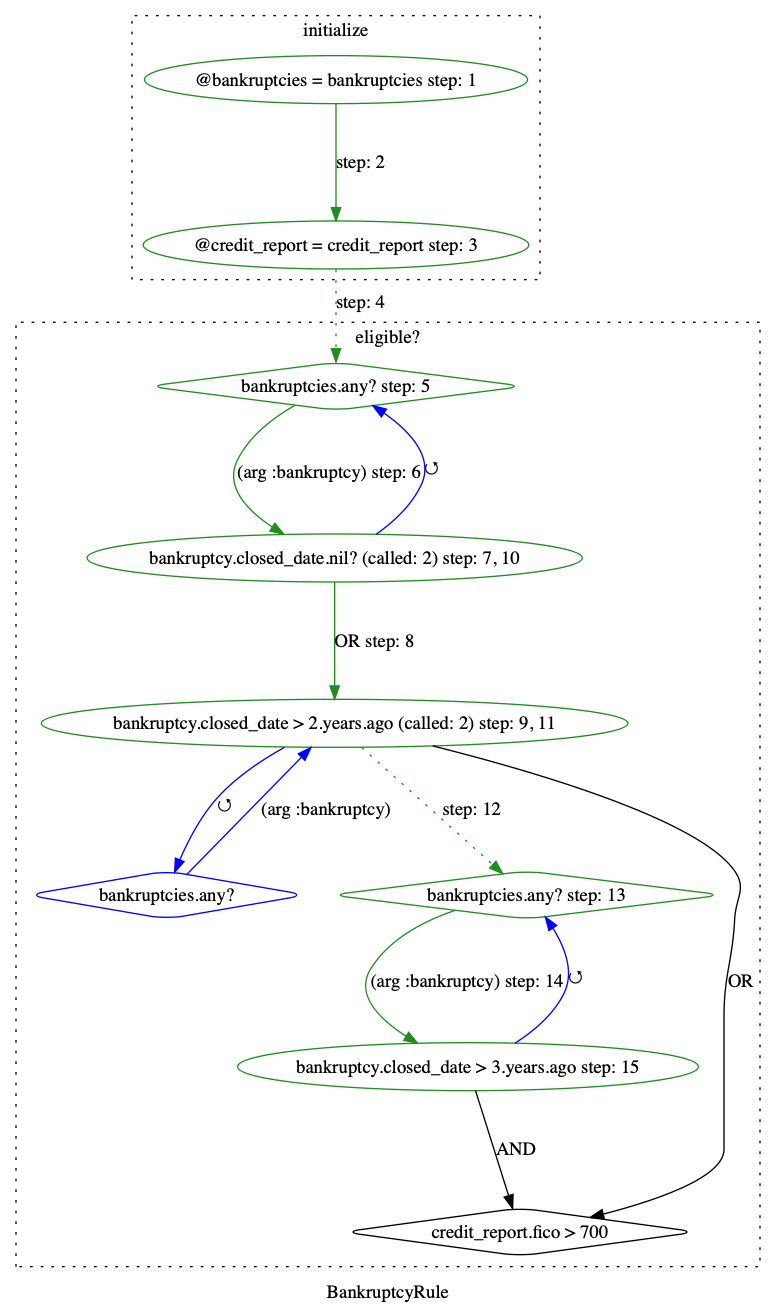
The following is a modified version of that decision rule to show the execution path.
Assigning ruby_code to a Pathname loads the file and builds the graph from the ruby source. Trace can also take a Pathname, but also a block. I’m sending in some stub data to exercise the code and finally setting the output_path.
VisualizeRuby.new do |vb|
  vb.ruby_code = Pathname("examples/bankruptcy_rule.rb")
  vb.trace do
    BankruptcyRule.new(
      credit_report: OpenStruct.new(fico: 800),
      bankruptcies:  [OpenStruct.new(closed_date: 2.years.ago)]
    ).eligible?
  end
  vb.output_path = "examples/bankruptcy_rule.png" # file name with media extension.
end
The resulting file shows nodes in green tracing the execution path. Then each step is numbered to avoid confusion when nodes and edges are traced more that once. Notice how method calls are in-lined, rather than represented in their own dashed box graph. Making it more cohesive while still maintaining the original idiomatic ruby in the source as to not make the user have to change the ruby code to make it look better on the graph. There may be some API to allow some control over this behavior in the future.
This project is still in beta, and it may not support all types of Ruby code. The execution highlighter works reasonably well, but it in an alpha state. I continue to work on this project and improve its abilities.
Let me know your thoughts and any compelling use cases you may come up.

